

Tour the Interface
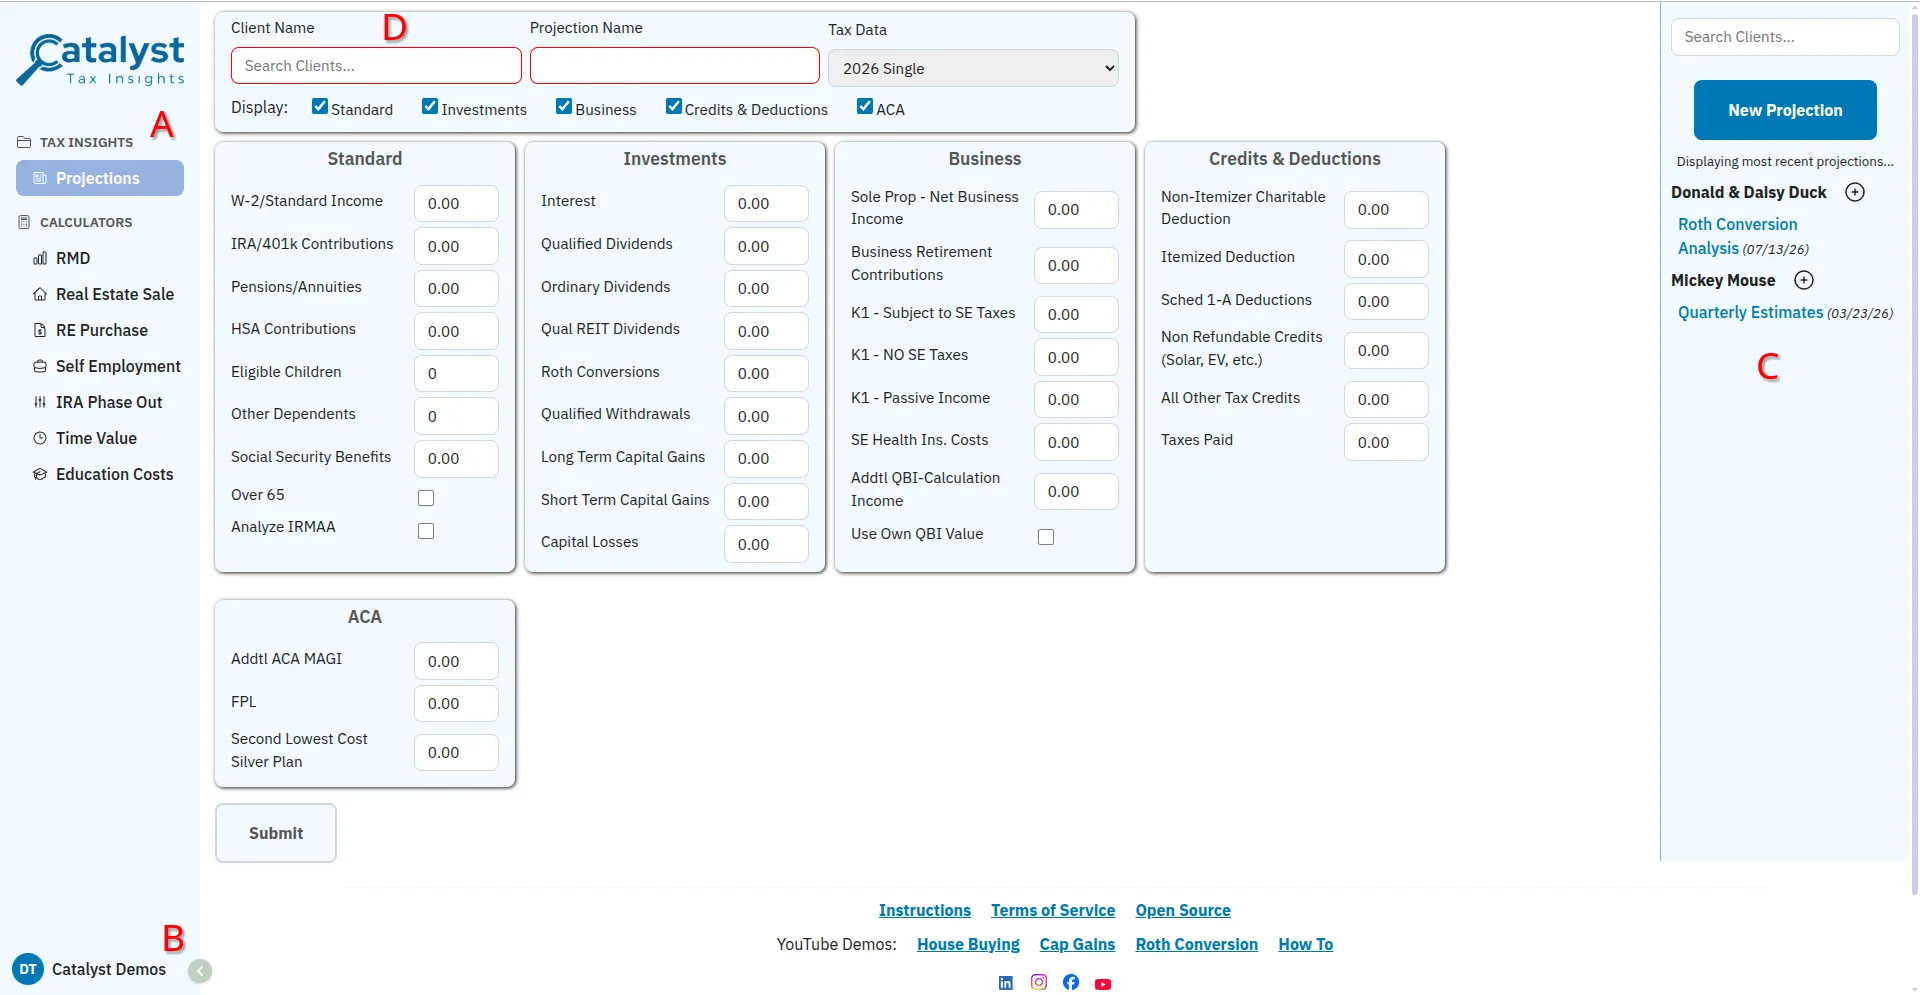
A - Navigation Pane
Section titled “A - Navigation Pane”The left side navigation pane can be used to navigate around the application and access the various tools and calculators provided. The remainder of this description is for the Projection feature of the application. You can see more details for other areas under Using the Product here in the Help Center.
B - User Account Control
Section titled “B - User Account Control”You can click this area to pop up a menu with settings related to Referral Codes, Settings, Support, or to Log Out.
C - Projection Pane
Section titled “C - Projection Pane”The Projection Pane is setup to give easy access to recent Projections that you have created, with an option to search for older results.
- By default, the Projection Pane shows the last 10 clients you have worked with and the last 5 Projections for each of those clients. You can change these values in Settings.
- You may Search using the “Search Clients…” box at the top. When searching for a client, you will get all the historic Projections for each client that matches your search text.
- A ‘New Projection’ button is available to start a new blank Projection at any time.
- You may also use the + button next to each client to start a new Projection for that client.
D - Projections Input
Section titled “D - Projections Input”The main content area of the screen allows a user to enter data to start a new projection.
- Client Name is a searchable box (Catalyst Pro only) to choose which client this projection will be saved under.
- Projection Name gives you a descriptive area to label your projections.
- Tax Data lets you choose the Year and Filing Status for your projection.
- Display lets you filter and hide sections that you do not use.
- The Standard / Investments / Business / Credits & Deductions / ACA sections exist to separate the input values for faster entry when doing a Projection.
Projection Results
Section titled “Projection Results”You can access the results page by:
- Creating a new Projection
- Adding a Scenario under a Projection
- Loading any Projection by choosing it in the Projection Pane
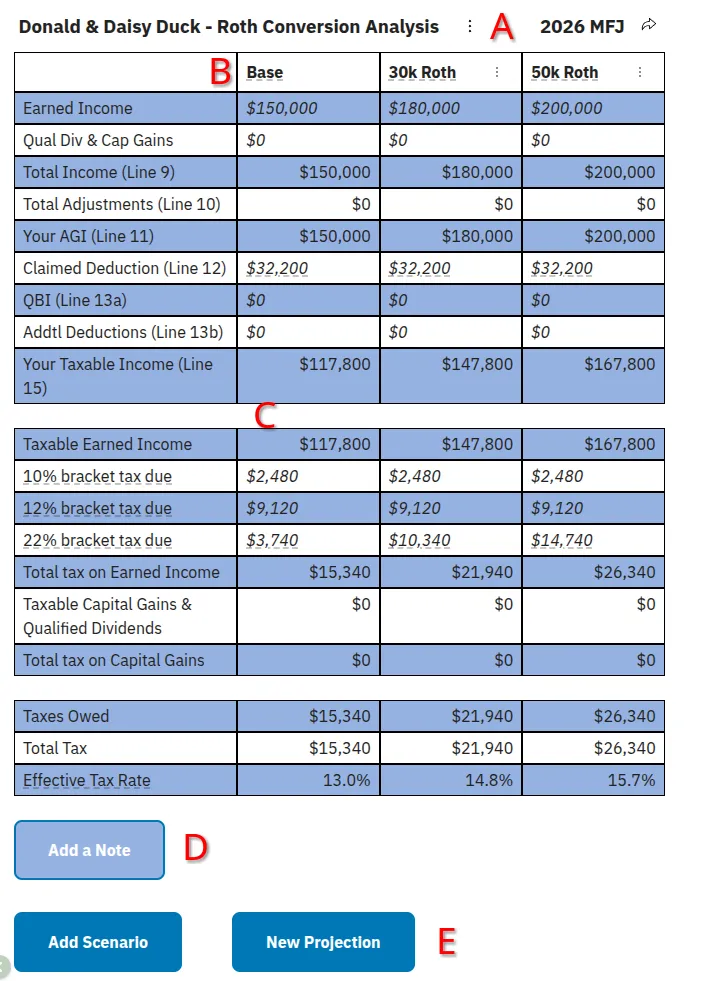
A - Results Header
Section titled “A - Results Header”The results header tells you about the Projection you are viewing.
- The client name and projection name.
- The vertical … menu allows you to Rename, Delete, or Save As to make a copy.
- The year and filing status are displayed toward the right.
- The arrow icon allows you to export to PDF, Excel, or Print the results.
B - Table Header
Section titled “B - Table Header”The header of the table tells you about the Projection and Scenarios already made.
- You can hover your mouse over any of the headers to see the values that were input into that column.
- The Base is the original data submitted to create the Projection.
- Each Scenario will then be listed sequentially, one per column. Scenarios may have been given a name when they were created or will be auto numbered “Scenario 1”, “Scenario 2”, etc.
- You can use the vertical … menu to…
- Save As Projection: Start a brand new Projection using the data that created this Scenario. This is useful if you came up with a good Scenario, but want to do further “What If?” analysis against it.
- Save As Scenario: Start a new Scenario inside this current Projection using the same data that created the selected Scenario. This is useful if you want to make some slight tweaks to the Scenario data entered.
- Rename Scenario: Change the display name of the Scenario.
- Delete Scenario: Permanently remove this Scenario from your Projection.
C - Results Table
Section titled “C - Results Table”Your Projection results will show up here in a table format.
- The Base column is your initial Projection input, followed by a column for each Scenario added.
- Rows can show up as needed - for example, NIIT will only display if one of your Scenarios has a non-zero NIIT value.
- Any field that has a dotted line under it has a tooltip that will display additional information when you hover your mouse over it. Tooltips vary by the field that you are hovering.
D - Add a Note
Section titled “D - Add a Note”You may add a note to your Projections here. Notes are useful for things such as to remember why you setup this Projection, what assumptions you were working on at the time, or some decisions that you took after the Projection.
E - Add / Start Over
Section titled “E - Add / Start Over”- The ‘Add Scenario’ button will allow you to add another Scenario into the existing Projection. Once saved, it will be added to the Results Table as a new column.
- The ‘New Projection’ button will allow you to create an entirely new Projection from scratch. This is the same as the button in the Projection Pane.